How VWAP is worked out from one day of 24 hourly candles
On this page
The formula is one line: two sums and a division
VWAP stands for Volume Weighted Average Price. For each slice of time you take one representative price, multiply it by the volume traded in that slice, add all of those up, then divide by the total volume.
VWAP = Σ (representative price × volume) ÷ Σ volume
The numerator is roughly how much money changed hands over the period and the denominator is how many coins did, so the division gives the average price each coin traded at. It differs from an ordinary average in one respect: hours with heavy trading weigh more, and hours with thin trading weigh less.
One choice for the representative price is the typical price: (high + low + close) ÷ 3. A candlestick chart draws only an hour's open, high, low and close, and averaging the high, low and close is a rough estimate of where that hour's trades took place. Some tools use the close instead, and the number comes out slightly different. This note uses the typical price, which you can work out by hand from the candles alone. The endpoint also returns each candle's volume in USDT, and the more precise figure that gives is in the questions at the end for comparison.
Intraday VWAP starts over each trading day. Crypto trades around the clock, and tools may differ on the moment a "day" begins; this note uses 00:00 UTC. The data is the BTC-USDT 1-hour candles returned by history-candles, an OKX public market data endpoint: all 24 of them for 22 September 2026, UTC.
Working out a single hourly candle
Start with the 00:00 UTC candle. High 86,632.6, low 85,870.1, close 85,903.6, and 342.19 BTC traded in the hour.
- Typical price = (86,632.6 + 85,870.1 + 85,903.6) ÷ 3 = 86,135.43.
- This is the day's first candle, with nothing before it to add, so VWAP at this point equals its typical price, 86,135.43.
The second candle, 01:00: high 85,987.1, low 85,405.2, close 85,620.2, typical price 85,670.83, volume 311.14 BTC. The two together:
(86,135.43 × 342.19 + 85,670.83 × 311.14) ÷ (342.19 + 311.14) = 85,914.17
The numerator is about 56.13 million USDT and the denominator is 653.33 BTC. The result sits closer to the first candle's 86,135.43 than to the second's typical price, because the first candle had more volume and so more weight. Had the two volumes been equal, the result would land exactly halfway between the two typical prices.
Chaining 24 candles into one line
Every later candle is the same move: add its typical price × volume to the numerator, add its volume to the denominator, and divide again. The full table follows; the last column is the cumulative VWAP once each hour has closed.
| Time (UTC) | Open | High | Low | Close | Volume (BTC) | Typical price | Cumulative VWAP |
|---|---|---|---|---|---|---|---|
| 00:00 | 86,617.9 | 86,632.6 | 85,870.1 | 85,903.6 | 342.19 | 86,135.43 | 86,135.43 |
| 01:00 | 85,903.7 | 85,987.1 | 85,405.2 | 85,620.2 | 311.14 | 85,670.83 | 85,914.17 |
| 02:00 | 85,620.2 | 85,876.1 | 85,391.3 | 85,727.7 | 187.58 | 85,665.03 | 85,858.60 |
| 03:00 | 85,727.7 | 85,761.8 | 85,309.1 | 85,697.2 | 190.00 | 85,589.37 | 85,808.98 |
| 04:00 | 85,697.3 | 85,743.4 | 85,429.0 | 85,464.2 | 152.29 | 85,545.53 | 85,775.07 |
| 05:00 | 85,464.3 | 85,600.0 | 85,111.1 | 85,412.6 | 219.49 | 85,374.57 | 85,712.40 |
| 06:00 | 85,412.7 | 85,578.3 | 85,257.1 | 85,384.9 | 133.85 | 85,406.77 | 85,685.78 |
| 07:00 | 85,385.0 | 85,507.2 | 85,160.0 | 85,344.9 | 684.16 | 85,337.37 | 85,578.44 |
| 08:00 | 85,344.8 | 86,375.1 | 85,319.2 | 86,215.5 | 375.16 | 85,969.93 | 85,635.02 |
| 09:00 | 86,216.0 | 86,280.8 | 85,680.9 | 86,261.0 | 293.51 | 86,074.23 | 85,679.63 |
| 10:00 | 86,261.0 | 86,268.3 | 85,750.0 | 85,901.1 | 159.54 | 85,973.13 | 85,694.99 |
| 11:00 | 85,901.2 | 86,147.7 | 85,776.0 | 85,992.6 | 170.74 | 85,972.10 | 85,709.69 |
| 12:00 | 85,992.6 | 86,203.4 | 85,774.4 | 86,030.6 | 215.60 | 86,002.80 | 85,728.08 |
| 13:00 | 86,030.6 | 86,372.7 | 85,584.3 | 86,354.5 | 379.01 | 86,103.83 | 85,765.42 |
| 14:00 | 86,355.8 | 86,476.9 | 85,455.0 | 86,256.4 | 468.57 | 86,062.77 | 85,797.95 |
| 15:00 | 86,260.7 | 86,731.0 | 86,125.2 | 86,419.0 | 386.20 | 86,425.07 | 85,849.82 |
| 16:00 | 86,419.1 | 86,595.9 | 86,075.6 | 86,422.1 | 283.25 | 86,364.53 | 85,879.26 |
| 17:00 | 86,422.1 | 86,664.2 | 86,256.0 | 86,579.3 | 246.77 | 86,499.83 | 85,908.72 |
| 18:00 | 86,580.0 | 86,652.0 | 86,241.0 | 86,458.2 | 210.61 | 86,450.40 | 85,929.81 |
| 19:00 | 86,458.3 | 86,590.9 | 86,150.2 | 86,201.2 | 238.12 | 86,314.10 | 85,946.01 |
| 20:00 | 86,201.2 | 86,380.6 | 86,136.4 | 86,266.4 | 111.52 | 86,261.13 | 85,952.11 |
| 21:00 | 86,277.7 | 86,354.8 | 86,186.6 | 86,188.9 | 91.21 | 86,243.43 | 85,956.65 |
| 22:00 | 86,187.1 | 86,306.5 | 86,001.8 | 86,125.9 | 175.06 | 86,144.73 | 85,962.12 |
| 23:00 | 86,126.0 | 86,514.9 | 86,092.2 | 86,209.1 | 166.37 | 86,272.07 | 85,970.45 |
The day's volume is 6,191.92 BTC and its VWAP is 85,970.45. The last candle closed at 86,209.1, 238.65 above VWAP. Volumes in the table are kept to two decimals, so adding them row by row gives 6,191.94, a difference of 0.02 from the sum of the raw endpoint data; a cumulative VWAP recomputed from the table may be slightly off in its last digit as well. Both come from rounding.
Read down the last column. In the first few rows the line moves by tens, even a hundred or more, in an hour; in the final hours it moves only a few USDT each hour. The typical price of the 23:00 candle was more than 300 above the VWAP just before it, yet the line rose by only 8.33. The more volume has accumulated, the smaller the share a new candle takes, and the heavier the line becomes.
The heavy 07:00 hour pulled the line down by 107
The day's biggest candle by volume is 07:00, at 684.16 BTC, over two hundred more than the runner-up, 14:00 with 468.57. Its typical price, 85,337.37, happens to be the lowest of all 24.
Through 06:00, the first 7 candles add up to about 1,536.5 BTC, with VWAP at 85,685.78. Once 07:00 is added the total is about 2,220.7 BTC, and the new candle is about 31% of it. The sum formula from the previous section has an equivalent form that shows the pull more plainly:
New VWAP = old VWAP + (this candle's typical price − old VWAP) × this candle's volume ÷ cumulative volume
With the numbers in: 85,685.78 + (85,337.37 − 85,685.78) × 684.16 ÷ 2,220.7 ≈ 85,685.78 − 107.34 = 85,578.44. That is a drop of 107 in one hour, and across the whole day only the opening step at 01:00 was bigger.
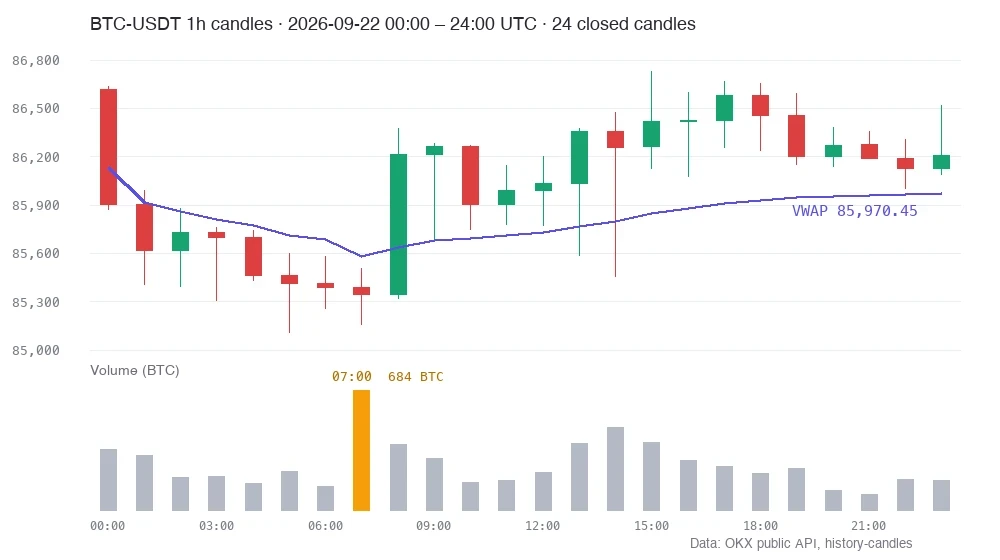
Right behind it, 08:00 is a long up candle: it opened at 85,344.8 and closed at 86,215.5, up more than 870 in the hour, on 375.16 BTC. The same formula gives 85,578.44 + (85,969.93 − 85,578.44) × 375.16 ÷ about 2,595.9 ≈ 85,635.02, which lifts the line back by a little over 56.
A candle where price barely moved but volume was huge dragged the line down by more than a hundred; a candle that rose more than 800 on a bit over half that volume pulled it back by only fifty-odd. VWAP records where the money traded most, and pays little attention to how far price shoots for a moment. The big block traded low at 07:00 stays inside the VWAP of every later hour that day, until the day is over.
Where the 47.76 between the average close and VWAP comes from
The 24 closes added together and divided by 24 come to 86,018.21. That is 47.76 above the VWAP of 85,970.45.
Two things are mixed into that 47.76. A simple average of the 24 typical prices is 85,994.12, or 23.67 above VWAP. That part comes from the volume weighting: hours like 07:00, with heavy volume at low prices, get extra weight and press VWAP down. The remaining 24 or so comes from the representative price itself, since on this day the closes averaged a little higher than the typical prices.
So two average prices that differ by a few tens, for the same day and the same coin, are nothing strange. Before you compare price with VWAP, find out which representative price the line in front of you uses and what time it starts counting from.
VWAP is built from prices and volumes that have already traded. It tells you at which prices the most money has changed hands up to this moment, and nothing about where price goes next. Price above or below the line is only the present state; anyone treating it as a buy/sell switch gets whipsawed whenever price crosses back and forth. Crypto prices swing hard, and with contracts and leverage losses are multiplied and can take your entire capital. Practise chart-reading on a demo account or with a very small amount first. This site covers chart-reading basics only, and nothing here is investment advice.
What VWAP can tell you when you read the chart
This day closed 238.65 above its VWAP, at 86,209.1. What that says is plain: the final hour traded a notch above the day's volume-weighted average price. Going roughly by typical price, a little over 70% of the day's volume fell in hours whose typical price was below that close. One use follows from this: set a fill of your own against VWAP to see whether you paid more or less than the day's average. That is a look at something that has already happened.
The line has habits worth knowing. Just after the start only one or two candles are in it, so it jumps around; later it grows heavy, and price sitting some way from it late in the day is normal, because the denominator is already large. It covers one day only and starts from zero the next. For a line that is calculated differently, see the moving average; for reading a single heavy-volume candle, see how volume goes with the candles.
A close above VWAP says price is above the day's average trading price at that moment; where price goes next is not something VWAP answers. If the candles aren't on your screen yet, start with setting up the chart on OKX.
Sources: candle data from OKX's public market data endpoint history-candles, requested as GET /api/v5/market/history-candles?instId=BTC-USDT&bar=1H, for BTC-USDT, 1-hour bars, 2026-09-22 00:00–24:00 (UTC), all 24 candles completed. The endpoint's parameters and return fields are as described in OKX's English API documentation in October 2026. Typical price, cumulative VWAP and the two simple averages are computed from this data with the formulas in the text, and the table keeps two decimals.
Common questions
When does VWAP reset?
Intraday VWAP starts accumulating afresh each trading day. Crypto never closes, and tools may differ on the moment a day begins. This note counts from 00:00 UTC. With a different starting point, a different set of candles goes into the total, so the VWAP you see at the same moment changes too.
Can VWAP be used like a moving average?
The two are calculated differently and don't swap in for each other. A simple moving average takes the closes of a fixed number of recent candles, weighs each one the same, and slides its window forward. VWAP accumulates from the starting point, weights by volume, and its window never slides; it only gets longer. So a moving average reacts at about the same speed at any time of day, while VWAP is sensitive just after the start and grows slower as the day goes on.
Is it fine to calculate VWAP from closing prices only?
Yes. Some tools use the close as the representative price; the formula is unchanged and the result differs slightly from the typical-price version. What matters is comparing like with like: the gap between a close-based figure and someone else's typical-price figure says nothing about the market. For a figure closer to the actual trades, divide total trading volume in USDT by total volume in BTC. This OKX endpoint also returns each candle's volume in the quote currency, which adds up to 532,160,604.72 USDT for the day; divided by the day's BTC volume that is 85,944.34, or 26.11 below the typical-price figure of 85,970.45. The 6,191.92 BTC in the table is rounded to two decimals, and 85,944.34 comes from the unrounded volume.